
The US Covid-19 pandemic may soon abate. A typical pattern of deaths from Covid-19 within a confined geographic/demographic boundary is characterized by rapid increase of deaths during a 4 to 6-week period followed by gradual decline during a 12 to 14-week period to near baseline. Deaths follow infections from 2.5 to 4-weeks, so rising infections precede rising deaths. The pattern of rapid rise with a sloping tail characterized New York State, New Jersey, Sweden, Lombardy region of Italy, London, and geographic areas where the virus failed to be initially contained (Figure 1).
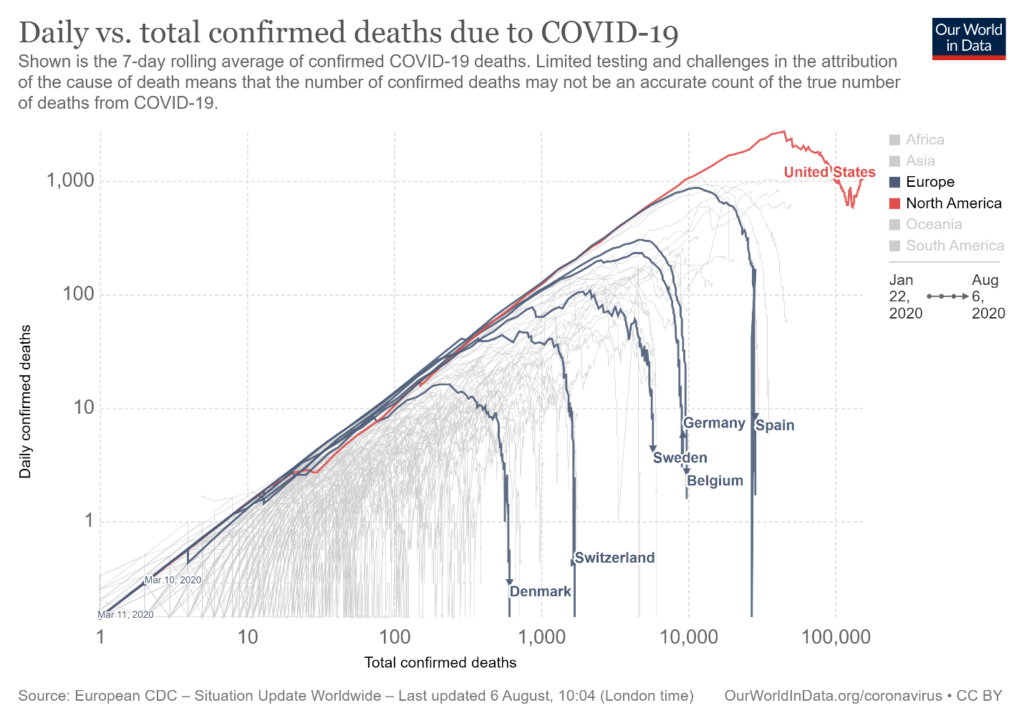
Figure 1: Illustration of rise and rapid fall of daily deaths. Chart is logarithmic, so the increase in deaths is normalized. Graphs are similar for metropolitan regions in the US North East during the initial phase of Covid-19 infections. The same pattern is likely to repeat in yet unaffected populous areas of the US. This continuing spread to “virgin” areas is why the US displays a irregular decline, and in fact, when the graph is updated may show a rise at the tail end before precipitous drop-off.
Who dies?
During the period of uncontrolled spread, the virus gained a wide foothold. A portion of the population appeared immune, another portion had only a mild bout. Most of the population were asymptomatic, particularly youth and young adults. What occurred was that the vulnerable died. A superb graphic from a Danish study titled “Characteristics and predictors of hospitalization and death in the first 9,519 cases with a positive RT-PCR test for SARS-CoV-2 in Denmark: A nationwide cohort” provides a heatmap for risk of death from Covid-19 in the Danish population (Figure 2). The Infection Fatality Rate (IFR) varies by age group and condition. The same clarity of data is not available from the Center for Disease Control and Prevention (CDC) since deaths and comorbidities are reported independently and vary state by state. However, the Danish data provides a reasonable proxy for the US.
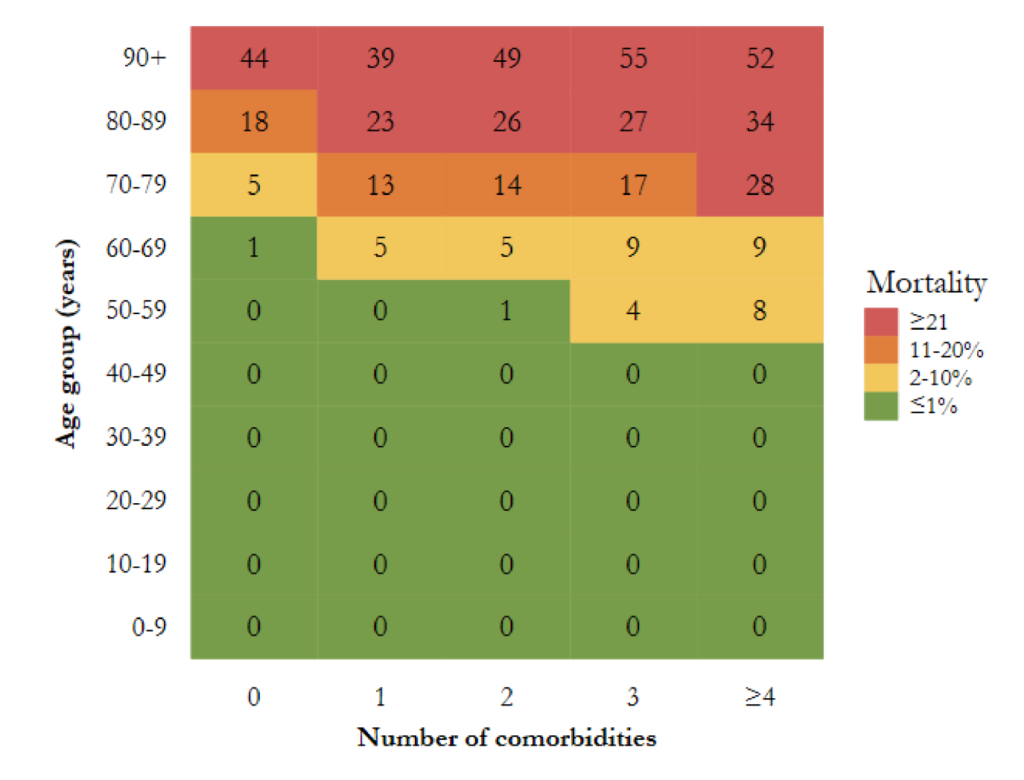
Figure 2. Heatmap illustrating mortality among SARS-CoV-2 PCR positive cases, specified by age and number of comorbidities. “Total number of comorbidities is assessed as the total number of any of the following conditions: Chronic lung disease, hypertension, ischemic heart disease, heart failure, atrial fibrillation, stroke, diabetes, dementia, cancer, chronic liver disease, hospital-diagnosed kidney disease, alcohol abuse, substance abuse, major psychiatric disorder, organ transplantation, overweight and obesity, and rheumatoid arthritis/connective tissue disease (Reilev et al, 2020, p 23).”
The Danish IFR for the 50 to 59 year old cohort with two health challenges is approximately 1.0; for the 60 to 69 year old cohort, approximately 5.0; for the 70 to 79 year old, 14.0; for the 80 to 89 year old, 26.0; and for the 90 to 99 year old, 49.0. The IFR for persons under 50 may be close to the value postulated by John Ioannidis, the Stanford epidemiologist, of 0.28. However, America ranks 46th in longevity among the world’s nations with high incidences of obesity, hypertension, and diabetes. The US is not Denmark. About 40% of US adults are clinically obese, 30% have hypertension, 10% are diabetic, and so the aggregate number of US citizens with “comorbidities” ranges from 20 to more than 50% depending upon age group. Therefore, the IFR for US persons under age 50 likely exceeds that of Denmark.
Need for Reappraisal of Covid-19 Trajectory
The view that herd immunity will be so readily obtained is not in accord with current guidance. The common view persists that herd immunity requires at least 60-80% of a population to be immune to the pathogen. This may be true in a “bounded, freely interacting group” where everybody has access to everybody else, and where every member has the same chance to be infected. But this is not the real world. Two factors mitigate against the “classical herd immunity” view that 60 to 80% of the population must be immune for the virus to stop circulating. The first factor is mathematical modeling of community spread, and the second is individual differences in immune resistance to the pathogen.
Herd Immunity Reconsidered
In the world persons occupy, groups are segmented by geography, occupation, living arrangements, family membership, travel habits, and a host of other variables. Persons that are most likely to be in close contact with a variety of people are most likely candidates to be infected and be carriers of the virus. These are people who take public transportation, meet face-to-face with the public, checkout stations; retail, factory, and office workers in tight quarters; service personnel, participants at conventions, fairs, and workshops, waiters at restaurants, transit police, attendees on cruise ships, hospital personnel, and the like.
In fact, all things being equal, risk can be calculated as a function of number of contacts, time in contact, and spatial distance among them. In the real world, people, high in risk are the people who catch and spread the virus. At the other extreme, homebodies just stay home. The high-risk group spreads the virus among themselves, sometimes “spilling over” into a low-risk demographic, but the low-risk demographic is self-limiting. The high-risk group rapidly infect one another, and like kindling burns brightly then quickly burns out.
A mathematical model of herd immunity divided groups into low interactive, average interactive, and high interactive. When interaction occurred predominantly within groups, the virus–induced herd immunity equaled 43% rather 60%. Proportionally, more persons were infected in groups with high contact than in groups with low contact. Acquired immunity for those most likely to carry the infection was therefore higher, and the overall rate of infection for the general population lower than if immunity was uniformly distributed as in classical herd immunity.
Viral Resistance
Immune responses to the virus include mobilization of T cells, intracellular responses, and production of antibodies. Memory T cells are likely instrumental in warding off infection. Research led by the La Jolla Institute for Immunology detected SARS-CoV-2-reactive CD4+ T cells in approximately 40%–60% of unexposed individuals, “suggesting cross-reactive T cell recognition between circulating “common cold” coronaviruses and SARS-CoV-2.” T cell intervention can confer partial or complete immunity to the Corona virus.
In addition, adaptive intracellular responses restore cellular integrity. A study in the Journal Trends in Pharmacological Sciences, conjectures, “ activation of transcription factor nuclear factor erythroid 2 p45-related factor 2 (NRF2) promotes resolution of inflammation and, in parallel, restores cellular redox and protein homeostasis, and facilitates tissue repair.” Thus, epigenetic variation may trigger intracellular processes to reinstate functionality following Covid-19 infection.
Finally, a great deal of public attention has been directed to antibodies since these are produced as a reaction to the disease and a marker for vaccine development. Types of antibodies and their kinetics appear to differ in symptomatic and asymptomatic persons. Covid-19 antibodies increase with the severity of the illness and wane in the months following illness.
T cell immunity likely provides a first line of defense to Covid-19. An adequate T cell response to the pathogen makes less likely a vigorous antibody response since the pathogen has been neutralized. Persons with compromised T cell production are usually sickest. The 40-60% of persons with T-cell cross-reactivity to Covid-19 likely proportionately increase herd-immunity.
The US Mega-Nation
After spiking in April due to the runaway infections in the New York metropolitan area, US infections trended downward until mid-July. Since the low, deaths approximately doubled into early August. However, deaths remained low in the New York metropolitan area and the North East US. The upward trend is almost entirely due to increased deaths in the South, South Western, and Western US. The demographic groups affected in these states are largely young adults visibly present at beach gatherings, partying, and protests (Figure 3).
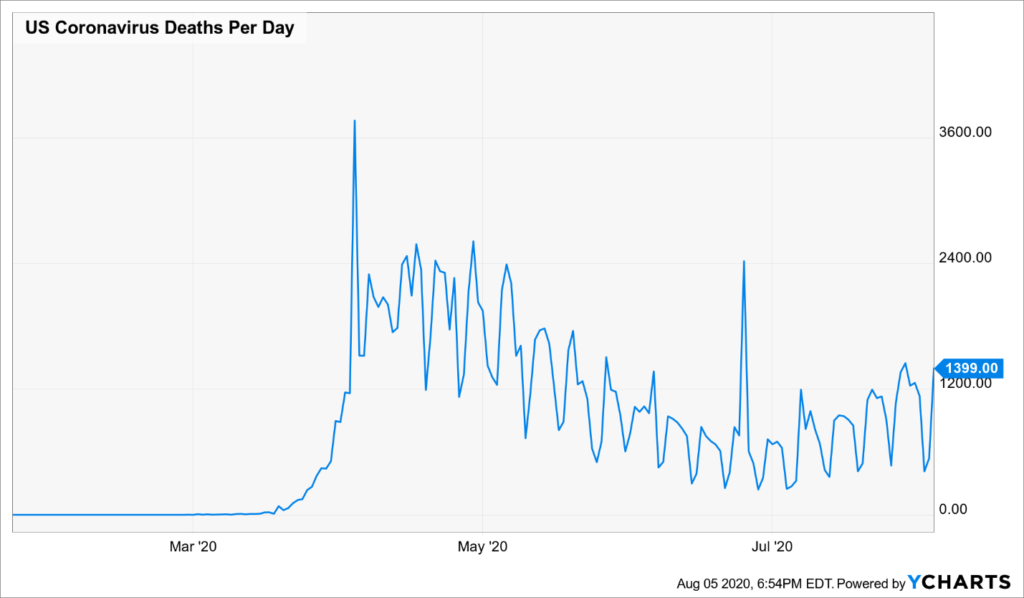
Figure 3: US Covid-19 Deaths. During March and April, deaths rose rapidly in the North East and the NY Metropolitan region, then fell to near baseline. Since early to mid-July, deaths are rising in the South and West, and have yet to decline. The chart sums across these regions. The seesaw variation occurs because deaths are not reported on weekends.
Other developing hotspots include cities in the Midwest and California’s Central Valley. These areas are generally less traveled, working class and farm areas late in exposure to the virus and prone to seasonal changes in work patterns and social aggregation. Poverty and comorbidities are higher among these demographics and so the Infection Fatality Rate (IFR) will be higher.
Earlier cohorts of Covid-19 patients in hospital intensive care units were comprised largely of older adults. Younger patients from the Sunbelt states are less likely to have comorbidities, less likely to die, and more likely to recover with fewer long-term sequelae. As many as 80% are asymptomatic, and most who are ill stay at home. This does not mean that symptomatic young adults escape convalescence or complications as “Covid-19 long-haulers” attest.
But just as in countries and states where Covid-19 was rampant, the pattern of Covid-19 infections follows the same rules: infections quickly spike within 4 to 6 week period followed by a taper to baseline within a 12 to 14 week period. Once this pattern has repeated itself in US locations where infections were low or non-existent, herd immunity will have been established. An infected carrier introduced into a community will not find suitable hosts –except for social isolates and insulated groups.
Conclusion
The US is highly diverse by age, culture, and geography. When partitioned, each group has its own activity level and transmission rate. The upper limit for herd immunity for the US overall is likely to be less than classical herd immunity. This is so because age, culture, and geography provide additional boundaries to interaction with highly proximate groups likely to first acquire and obtain immunity to the virus. These are the past and current hotspots. Hotspots flare-up then retreat.
The protesting, mixing, and partying that has characterized large swaths of the US may reflect a primal adaptation to speed herd immunity. Precisely those groups most likely to spread the virus to less active groups are cleansing their group by sharing the virus among themselves, thereby reducing the likelihood of transmission to the general population. Sequestered groups remain relatively unaffected. Based on mathematical modeling, herd immunity is likely to fall between 40 to 60%. If as research suggests, 40 to 60% of the population possess cross-reactive T cells, immunity is again enhanced by a large fraction. The lower value for herd immunity and the unexpected high incidence for cross-reactive T cell immunity among individuals is consistent with data from serological antibody tests to Covid-19 in the range of 12 to 18 percent found in community studies following return to baseline after rampant Covid-19 infection.
The current round of US Covid-19 infection remains dangerous to susceptible groups. Social distancing, masks, hand-washing, and other precautions ought to be practiced. However, the updated model of herd immunity, and new findings from cross-T cell immunity, mechanisms of cellular resistance, and Covid-19 serology suggest that the Covid-19 fire may soon turn to embers. After the hotspots have been consumed, infectious risk is likely to fall dramatically. Much of ordinary life will resume.
If the timeline for current infections in the US follows the same timeline as the virus followed in other locals, the worst of the Southern and Western flare-ups will have abated by early November. As the virus works its way to communities that have remained unaffected to the present, the virus will have followed its course by the end of March. After that, an occasional flare-up may occur, but without the dire risk attendant to virgin territory. Of course, all this is baring a new variety of the virus that evades earlier immunity, then a new chapter must be written.
Comments
194 responses to “Light at the End of the Covid-19 Tunnel”
canadian cialis no prescription
canadian cialis no prescription
imiquimod pharmacy
imiquimod pharmacy
rohypnol mexico pharmacy
rohypnol mexico pharmacy
when to take tadalafil
when to take tadalafil
female viagra no prescription
female viagra no prescription
vardenafil vs tadalafil
vardenafil vs tadalafil
order viagra no prescription
order viagra no prescription
pharmacy warfarin protocol
pharmacy warfarin protocol
cialis side effects a wife’s perspective
cialis side effects a wife’s perspective
sildenafil discount
sildenafil discount
buy generic viagra soft tabs
buy generic viagra soft tabs
female pink viagra
female pink viagra
real viagra without a prescription
real viagra without a prescription
purchase viagra safely online
purchase viagra safely online
generic viagra online pharmacy canada
generic viagra online pharmacy canada
generic for cialis in the usa
generic for cialis in the usa
buying cialis generic
buying cialis generic
cialis black buy in australia
cialis black buy in australia
cialis american express
cialis american express
transdermal metronidazole
transdermal metronidazole
gabapentin 00mg
gabapentin 00mg
sulfamethoxazole-trimethoprim clinical use
sulfamethoxazole-trimethoprim clinical use
valacyclovir pka
valacyclovir pka
can pregabalin cause seizures
can pregabalin cause seizures
tamoxifen teeth
tamoxifen teeth
lisinopril hartkloppingen
lisinopril hartkloppingen
glucophage manufacturer
glucophage manufacturer
molecola furosemide
molecola furosemide
animal in rybelsus commercial
animal in rybelsus commercial
rybelsus kidney stones
rybelsus kidney stones
semaglutide 96 units
semaglutide 96 units
flagyl utslag
flagyl utslag
zoloft cost without insurance
zoloft cost without insurance
cymbalta snri
cymbalta snri
is 1000 mg of cephalexin too much
is 1000 mg of cephalexin too much
best time to take duloxetine 30 mg
best time to take duloxetine 30 mg
what is escitalopram
what is escitalopram
cheap viagra 100 online
cheap viagra 100 online
is keflex safe for pregnancy
is keflex safe for pregnancy
fluoxetine for kids
fluoxetine for kids
gabapentin somministrazione
gabapentin somministrazione
natural amoxicillin
natural amoxicillin
ciprofloxacin brand name
ciprofloxacin brand name
can you drink with cephalexin
can you drink with cephalexin
bactrim vs amoxicillin
bactrim vs amoxicillin
can you eat ice cream while taking bactrim
can you eat ice cream while taking bactrim
effexor 150 mg
effexor 150 mg
how long does augmentin take to work
how long does augmentin take to work
flomax off label use in women
flomax off label use in women
ezetimibe chemical name
ezetimibe chemical name
diclofenac sodium topical gel 1%
diclofenac sodium topical gel 1%
ddavp chemotherapy
ddavp chemotherapy
successfully coming off citalopram 10mg
successfully coming off citalopram 10mg
cozaar vs benicar
cozaar vs benicar
diltiazem calcium channel blocker
diltiazem calcium channel blocker
contraves 7-segment anzeige
contraves 7-segment anzeige
how does flexeril work
how does flexeril work
depakote vs lamictal
depakote vs lamictal
aripiprazole uses
aripiprazole uses
amitriptyline for sleep and anxiety
amitriptyline for sleep and anxiety
is aspirin ibuprofen
is aspirin ibuprofen
how long does it take for allopurinol to lower uric acid levels?
how long does it take for allopurinol to lower uric acid levels?
celecoxib vs ibuprofen
celecoxib vs ibuprofen
celexa and adderall
celexa and adderall
is buspar addictive
is buspar addictive
baclofen dose
baclofen dose
how does bupropion make you feel
how does bupropion make you feel
augmentin strengths
augmentin strengths
buy ashwagandha
buy ashwagandha
abilify 5 mg
abilify 5 mg
remeron vs wellbutrin
remeron vs wellbutrin
glyburide vs repaglinide
glyburide vs repaglinide
protonix dose
protonix dose
joint pain semaglutide
joint pain semaglutide
what is robaxin 750
what is robaxin 750
actos pdr
actos pdr
obat acarbose.pdf
obat acarbose.pdf
ivermectin syrup
ivermectin syrup
spironolactone therapeutic use
spironolactone therapeutic use
synthroid crying
synthroid crying
can i take amitriptlyene with voltaren
can i take amitriptlyene with voltaren
venlafaxine withdrawl
venlafaxine withdrawl
is sitagliptin and vildagliptin same
is sitagliptin and vildagliptin same
tizanidine hcl 4mg side effects
tizanidine hcl 4mg side effects
tamsulosin iris
tamsulosin iris
cialis online pills
cialis online pills
free tadalafil
free tadalafil
sildenafil brand
sildenafil brand
compounding pharmacy low dose naltrexone
compounding pharmacy low dose naltrexone
levitra 40 mg reviews
levitra 40 mg reviews
cialis bangkok pharmacy
cialis bangkok pharmacy
how long does 20mg sildenafil last
how long does 20mg sildenafil last
10mg levitra buy
10mg levitra buy
sildenafil tadalafil vardenafil
sildenafil tadalafil vardenafil
ivermectin generic name
ivermectin generic name
buy stromectol pills
buy stromectol pills
vardenafil dosage 40 mg
vardenafil dosage 40 mg
viagra professional pfizer
viagra professional pfizer
stromectol 3 mg tablets price
stromectol 3 mg tablets price
stromectol tab
stromectol tab
tadalafil/oxytocin sublingual troches
tadalafil/oxytocin sublingual troches
stromectol 0.5 mg
stromectol 0.5 mg
ivermectin 3mg dosage
ivermectin 3mg dosage
buy liquid tadalafil
buy liquid tadalafil
viagra 100mg cost in india
viagra 100mg cost in india
trazodone dosage for anxiety
trazodone dosage for anxiety
nolvadex vs arimidex
nolvadex vs arimidex
valtrex dosage cold sores
valtrex dosage cold sores
can you drink while on amoxicillin
can you drink while on amoxicillin
keflex for cellulitis dose
keflex for cellulitis dose
lyrica for nerve pain
lyrica for nerve pain
how to stop diarrhea from metformin
how to stop diarrhea from metformin
can i drink alcohol while taking cephalexin
can i drink alcohol while taking cephalexin
is 2.5 mg lisinopril a low dose
is 2.5 mg lisinopril a low dose
medications ciprofloxacin
medications ciprofloxacin
provigil everyday
provigil everyday
side effects doxycycline
side effects doxycycline
levitra cialis order
levitra cialis order
“vardenafil hcl tabs \”no prescription\” india pharmacy”
“vardenafil hcl tabs \”no prescription\” india pharmacy”
how long does it take for watermelon viagra to work
how long does it take for watermelon viagra to work
tadalafil buy online
tadalafil buy online
online pharmacy without prescriptions
online pharmacy without prescriptions
sildenafil interactions with alcohol
sildenafil interactions with alcohol
sildenafil roman
sildenafil roman
is sildenafil covered by insurance
is sildenafil covered by insurance
sildenafil mechanism of action
sildenafil mechanism of action
sildenafil 50 mg price
sildenafil 50 mg price
prescription pricing
prescription pricing
levitra dose
levitra dose
tadalafil versus sildenafil
tadalafil versus sildenafil
levitra dosage 60 mg
levitra dosage 60 mg
cialis coupon
cialis coupon
chrisale tadalafil 20 mg para que sirve
chrisale tadalafil 20 mg para que sirve
sildenafil 100mg coupon cvs
sildenafil 100mg coupon cvs
Combivir
Combivir
cialis bodybuilding
cialis bodybuilding
tadalafil vs sildenafil vs vardenafil
tadalafil vs sildenafil vs vardenafil
sildenafil for women
sildenafil for women
european pharmacy viagra
european pharmacy viagra
tadalafil 20 mg how long does it take to work
tadalafil 20 mg how long does it take to work
how long does tadalafil 10mg last
how long does tadalafil 10mg last
sildenafil and tadalafil combination reddit
sildenafil and tadalafil combination reddit
tadalafil benefits
tadalafil benefits
propecia uk pharmacy
propecia uk pharmacy
medical pharmacy west
medical pharmacy west
etodolac mr
etodolac mr
how much gabapentin can i give my dog
how much gabapentin can i give my dog
gabapentin sertraline
gabapentin sertraline
carbamazepine cr side effects
carbamazepine cr side effects
how many mg of ibuprofen for kids
how many mg of ibuprofen for kids
sulfasalazine indigestion remedies
sulfasalazine indigestion remedies
how does elavil help pain
how does elavil help pain
cilostazol phosphodiesterase inhibitor
cilostazol phosphodiesterase inhibitor
indomethacin pleurisy
indomethacin pleurisy
medications amitriptyline
medications amitriptyline
effets indésirables du lioresal
effets indésirables du lioresal
imdur biverkning
imdur biverkning
stopping azathioprine treatment
stopping azathioprine treatment
baclofen pump battery life
baclofen pump battery life
manfaat tablet piroxicam
manfaat tablet piroxicam
imuran sarcoidosis
imuran sarcoidosis
can you take zanaflex with suboxone
can you take zanaflex with suboxone
can i buy cheap ketorolac no prescription
can i buy cheap ketorolac no prescription
effects of tizanidine
effects of tizanidine
periactin nederland
periactin nederland
st pauls artane fc facebook
st pauls artane fc facebook
cyproheptadine surdosage
cyproheptadine surdosage
how to buy generic toradol no prescription
how to buy generic toradol no prescription
acheter kamagra dans une pharmacie américaine sans ordonnance
ordre à croquer kamagra
cheap enclomiphene mastercard buy
get enclomiphene cheap generic uk
pfizer brand androxal made in usa
buying androxal purchase online from india
buying dutasteride purchase in australia
buy dutasteride canadian pharmacy no prescription
cheapest buy flexeril cyclobenzaprine canada suppliers
buying flexeril cyclobenzaprine usa cheap
how to order gabapentin australia discount
ordering gabapentin purchase prescription
how to order fildena price south africa
foreign drug purchase without prescription fildena
online order itraconazole canada cost
ordering itraconazole cheap store
buy staxyn generic london
discount staxyn generic overnight delivery
avodart without a perscription cheap
get avodart canada low cost
buying xifaxan generic when will be available
online order xifaxan canada price
cheapest buy rifaximin american express
canadian cheap rifaximin with free pills
bez lékařského předpisu levné kamagra
paypal za kamagra
tadalafil price cvs
tadalafil price cvs
cenforce 150mg price
cenforce 150mg price
viagra and appetite
viagra and appetite
vidalista 20mg for sale
vidalista 20mg for sale
sildenafil overdose dog
sildenafil overdose dog
doxycycline monohydrate dosing
doxycycline monohydrate dosing
is sildenafil used for blood pressure
is sildenafil used for blood pressure
cialis health benefits
cialis health benefits
toradol effect duration
toradol effect duration
ivermectin scabies treatment
ivermectin scabies treatment
minoxidil help & answers
minoxidil help & answers
minoxidil foam vs liquid comparison
minoxidil foam vs liquid comparison
minoxidil onset clinical data
minoxidil onset clinical data